> ## Documentation Index
> Fetch the complete documentation index at: https://docs.bango.com/llms.txt
> Use this file to discover all available pages before exploring further.
# DCB dashboard - Advanced
Bango provides two types of Dashboards for Payments Provider partners. This page will highlight the Advanced dashboard functionality.
## Where to Access
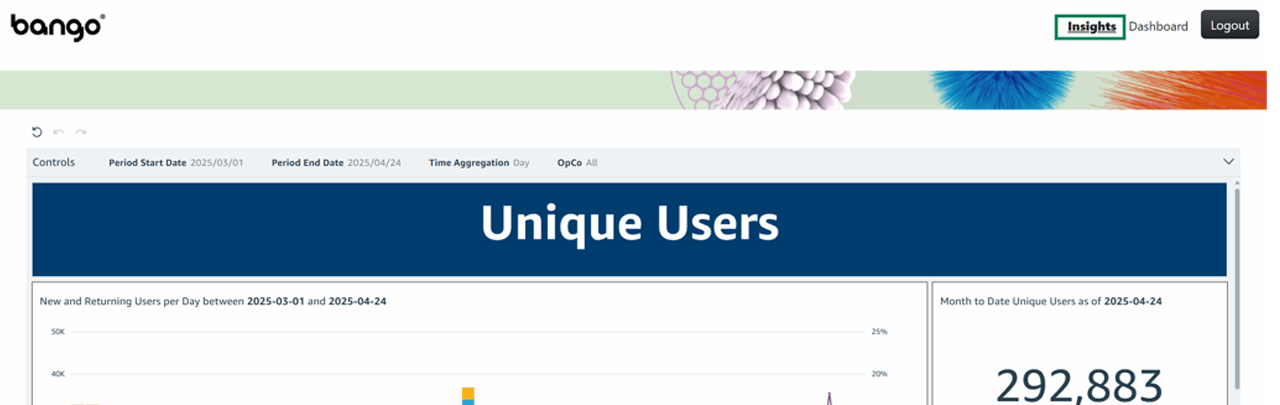
In order to access the dashboard, you should navigate to the Bango back office dashboard as normal. In the top right of the screen, there will be a tab in the top right called **Insights**. Click this to be taken to the new dashboard, as can be seen in the below image.
If you can't see this link, reach out to to your account manager for access.
 There may be issues with displaying some of the graphs if the cookie settings on your browser are not correct. Please make sure your 3rd party cookies are enabled if you are facing difficulties in getting the visuals to display
Please also note that this dashboard will be updated at 09:00 UTC each day. Until then, it will be displaying data for the previous day.
### Navigating the Dashboard
#### Filters
Once in the dashboard, there is a series of filters at the top of the page, next to the title “Controls”. This will allow you to filter the data to show the time period and OpCo (or OpCos) that you are interested in. The filters in the control bar will alter data for the entire sheet, regardless of whether it is in the Unique Users or Error Metrics section. The control bar can be seen in the image below.
There may be issues with displaying some of the graphs if the cookie settings on your browser are not correct. Please make sure your 3rd party cookies are enabled if you are facing difficulties in getting the visuals to display
Please also note that this dashboard will be updated at 09:00 UTC each day. Until then, it will be displaying data for the previous day.
### Navigating the Dashboard
#### Filters
Once in the dashboard, there is a series of filters at the top of the page, next to the title “Controls”. This will allow you to filter the data to show the time period and OpCo (or OpCos) that you are interested in. The filters in the control bar will alter data for the entire sheet, regardless of whether it is in the Unique Users or Error Metrics section. The control bar can be seen in the image below.
 Each of them has a small “info” icon next to the title, which if hovered over with a mouse, will provide you with a prompt. A small summary of what the filters control is given in the following table.
| Filter Name | Function | Extra Comments |
| - | - | - |
| Period Start Date | Allows you to select the starting date of the period you wish to see data for. It is in a YYYY/MM/DD format. | Will default to the beginning of the previous month when opening the dashboard. |
| Period End Date | Allows you to select the ending date of the period you wish to see data for. It is in a YYYY/MM/DD format | Will default to the current date (UTC) when opening the dashboard. |
| Time Aggregation | Allows you to choose the granularity with which you see time series data. For instance, you can see unique users by day, week, or month | Will default to Day when opening the dashboard. |
| OpCo | Allows you to display data for any OpCo or combination of OpCos. | This will default to All when opening the dashboard. |
### Screen Detail - Explanations
The dashboard is split into two sections in the current iteration - ***Unique Users*** and ***Error Metrics***. The following section contains a PDF of the dashboard with a number assigned to each visual.
Each of them has a small “info” icon next to the title, which if hovered over with a mouse, will provide you with a prompt. A small summary of what the filters control is given in the following table.
| Filter Name | Function | Extra Comments |
| - | - | - |
| Period Start Date | Allows you to select the starting date of the period you wish to see data for. It is in a YYYY/MM/DD format. | Will default to the beginning of the previous month when opening the dashboard. |
| Period End Date | Allows you to select the ending date of the period you wish to see data for. It is in a YYYY/MM/DD format | Will default to the current date (UTC) when opening the dashboard. |
| Time Aggregation | Allows you to choose the granularity with which you see time series data. For instance, you can see unique users by day, week, or month | Will default to Day when opening the dashboard. |
| OpCo | Allows you to display data for any OpCo or combination of OpCos. | This will default to All when opening the dashboard. |
### Screen Detail - Explanations
The dashboard is split into two sections in the current iteration - ***Unique Users*** and ***Error Metrics***. The following section contains a PDF of the dashboard with a number assigned to each visual.
The table below gives a description of what each visual is showing, as well as how it interacts with other visuals.
#### Unique Users & Error Metrics:
| Unique Users | Filters others? | | Error Metrics | Filters others? |
| - | - | - | - | - |
| New vs returning users over the selected period, plus new users as a % of total, at the selected granularity. | No | | Successful vs unsuccessful transactions and the transaction error rate, over the selected period and granularity. | Yes. filters the other Error Metrics visuals by Date (right click → "Filter by Date") |
| Month-to-date unique users (latest month in the selected period). | No | | Transaction error rate broken down by OpCo, over the selected period and granularity. | Yes. filters the other Error Metrics visuals by OpCo |
| % of MTD unique users who are new (never transacted before this month), latest month in the selected period. | No | | Error counts split by error code, over the selected period and granularity. | Yes. filters the OpCo, action type, action outcome and table visuals by Date, Error Code, or both |
| Month-on-month comparison of cumulative unique users by day of month; latest month vs the month before. Resets to 0 at midnight on day 1. | No | | Total errors by OpCo, totalled across the period; ignores time granularity. | Yes. filters the error code, action type, action outcome and table visuals by OpCo |
| Month-on-month comparison of cumulative *new* users by day of month; same comparison and reset logic as the visual above. | No | | Errors by transaction stage (action type), totalled across the period; ignores time granularity. | Yes. filters the error code, OpCo, action outcome and table visuals by Action Type |
| | | | Errors by error type / action outcome (e.g. denied, failed), totalled across the period; ignores time granularity. | Yes. filters the error code, OpCo, action type and table visuals by Action Outcome |
| | | | Table of total errors by time, OpCo, action type, action outcome and error code; totalled across the period, ignores time granularity. | No |
#### Cancellations, Refunds & Top 10 Apps
| Cancellations & Refunds | Filters others? | | Top 10 Apps | Filters others? |
| - | - | - | - | - |
| Total canceled and refunded transactions over time, at the selected period and granularity. | No | | Top apps across all routes by MTD transaction count, as of the latest date in the selected period. Right click → "Drill Down to OpCo" splits an app's MTD transactions by OpCo. | Yes — filters the other Top 10 Apps visuals by App Name |
| MTD cancelled transactions (latest month in the selected period). | No | | Top ten apps per OpCo for the latest month, ranked by MTD EUS, as of the last day of the selected period. Columns: MTD Gross EUS (local currency), % of Total MTD Gross EUS (never reaches 100%), MTD Trx Count, MTD Unique Users, Avg Trx Value. | Yes — filters the other Top 10 Apps visuals by App Name or OpCo |
| MTD refunded transactions (latest month in the selected period). | No | | Transaction count per OpCo over time across the full selected period (not MTD). Right click an OpCo line to drill down to per-app transaction counts. Granularity follows the Time Aggregation filter. | Yes — filters the other Top 10 Apps visuals by OpCo |
| MTD table by OpCo and currency (no common currency metric yet): Captured Amount Local Currency (Gross EUS), Refunded Amount Local Currency, Average Refund Value, Net EUS (captured − refunded), Projected Gross EUS, Projected Refunded Amount, Projected Net EUS. Projections are linear extrapolations from MTD figures. | No | | | |