

- The total number of entitlements over time
- New activation, pending activation, cancellation, and suspension events
- Entitlement activity by product
On a mobile device, use landscape orientation to make the graphs easier to view and interact with.
Select a Partner and environment
The Dashboard displays data for the selected Partner and environment. DVM resolves the underlying Regional Entities used to provide that data; you do not need to select them individually. If your account has access to more than one Partner, use the Partner selector at the top-left of the page to select the Partner you want to view. Select the environment you want to work in where that option is available. The selector only displays Partners and environments that your user has permission to access.Select a time period
Use the time filter at the top of the page to select:- This month
- Last month
- Last 12 months
- Custom

- This month and Last month support daily, weekly, and monthly intervals.
- Last 12 months supports weekly and monthly intervals.
Filter by counterparty
If the selected Partner works with more than one counterparty, use the Partner filter to display data for:- All partners
- A specific partner
View cumulative entitlements
The Cumulative entitlements graph shows how the total number of entitlements changes over the selected period.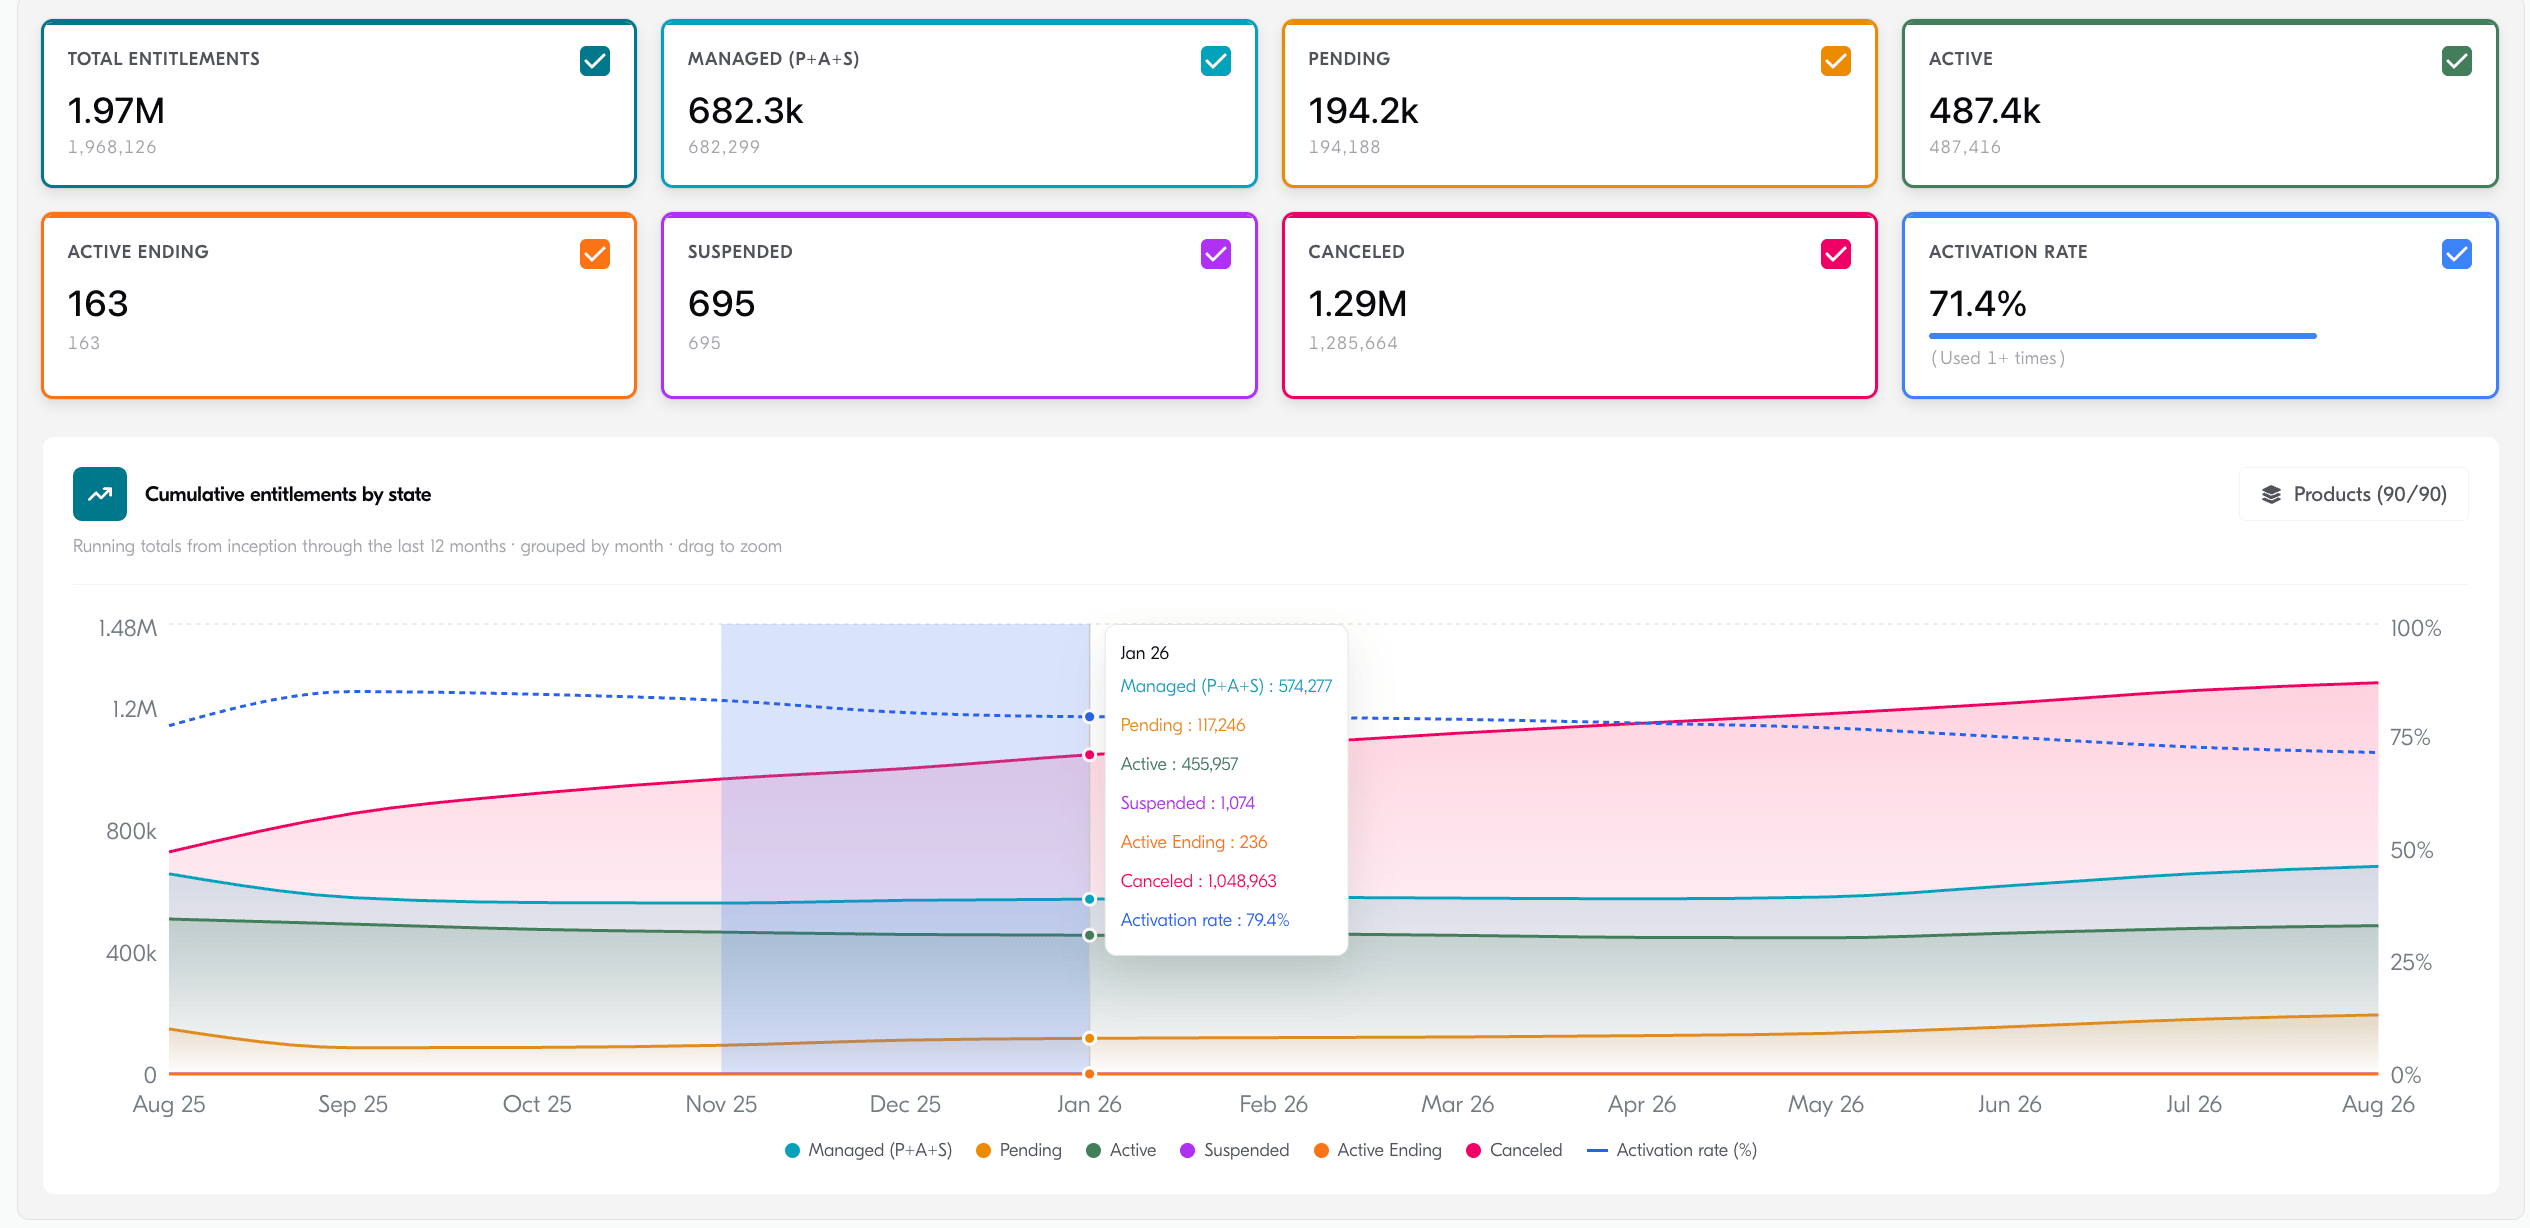
Select metrics
The scorecards above the graph represent the available metrics. Select a scorecard to show or hide its metric on the graph. The graph legend identifies each displayed metric by color and updates when you change the selected scorecards.Filter by product
If the selected partner has more than one product, use the Products filter at the top-right of the graph to select the products you want to include. All products are selected by default.Zoom into a time period
Select and drag across the graph to examine a shorter time period. Select Reset zoom to return to the complete selected period. On a touchscreen device, touch and hold the graph, then drag across the period you want to view.View new entitlement events
The New entitlement events graph shows entitlement lifecycle events that occurred during the selected period, including:- Activations
- Pending activations
- Cancellations
- Suspensions
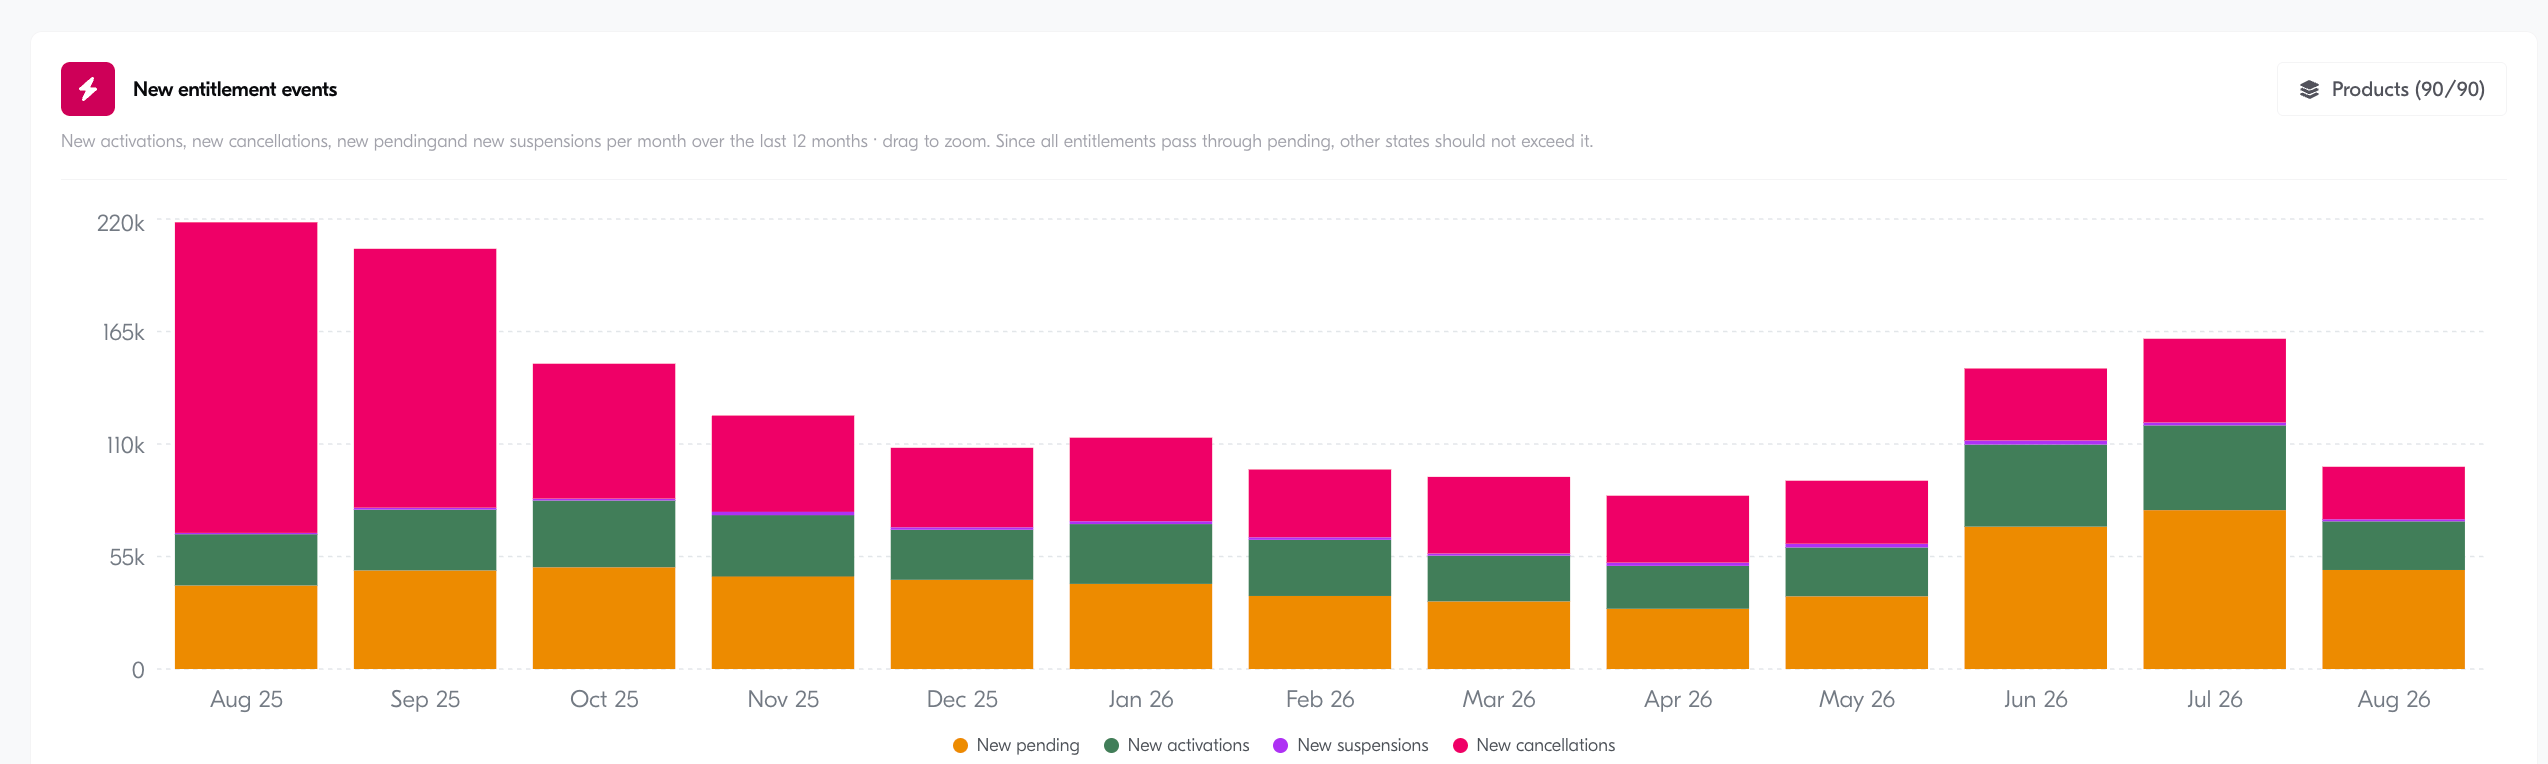
New entitlement event data is available for a maximum period of 12 months.
View the product breakdown
The Product breakdown graph compares entitlement activity across the products associated with the selected partner or partners. For each product, the graph shows new activated and pending entitlements during the selected period. Products without entitlement events are hidden by default. Select Show n with no events to include them, where_n_ is the number of products without activity during the selected period.
Troubleshoot missing data
The Dashboard displays an empty state when no metrics match the selected filters. If you expect to see entitlement activity:- Select a wider time period.
- Select All partners or a different partner.
- Check that the relevant products are selected.
- Confirm that you selected the correct Partner and environment.